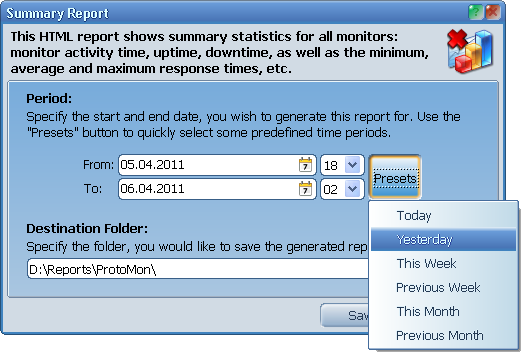
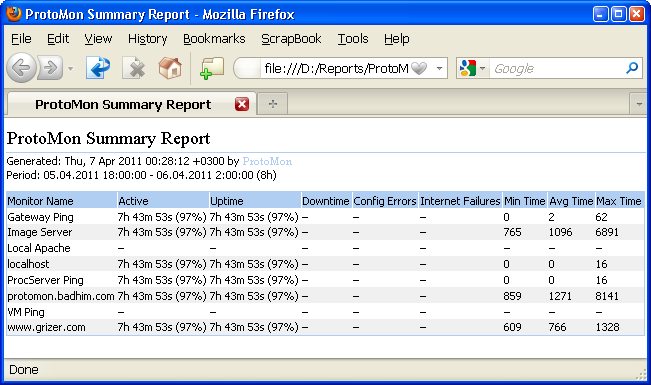
ProtoMon is a
server monitoring software
intended to continuously check your servers and computers at specified
intervals and immediately notify you about any problems.
Features:
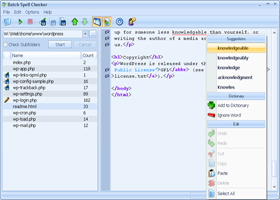
BatchSpellChecker is a professional code-aware batch
spell checker
software for the programmers, web developers, proofreaders and other
people who need to deal with a large number of source code files and
documents.
Features:
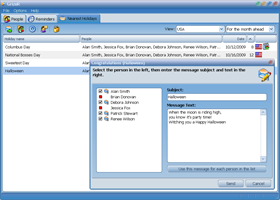
GrizeR is a powerful and easy-to-use holiday and birthday
reminder software
with a built-in e-mail client to send the letters of congratulation.
Features:
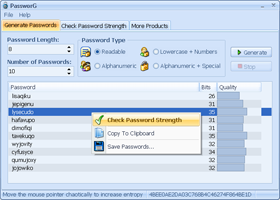
PassworG is a portable and free
password generator software
with a built-in password quality checker.
Features:
|